Understand the workflow of your teams
Use powerful data to increase the productivity of software development.
 Get Started Today
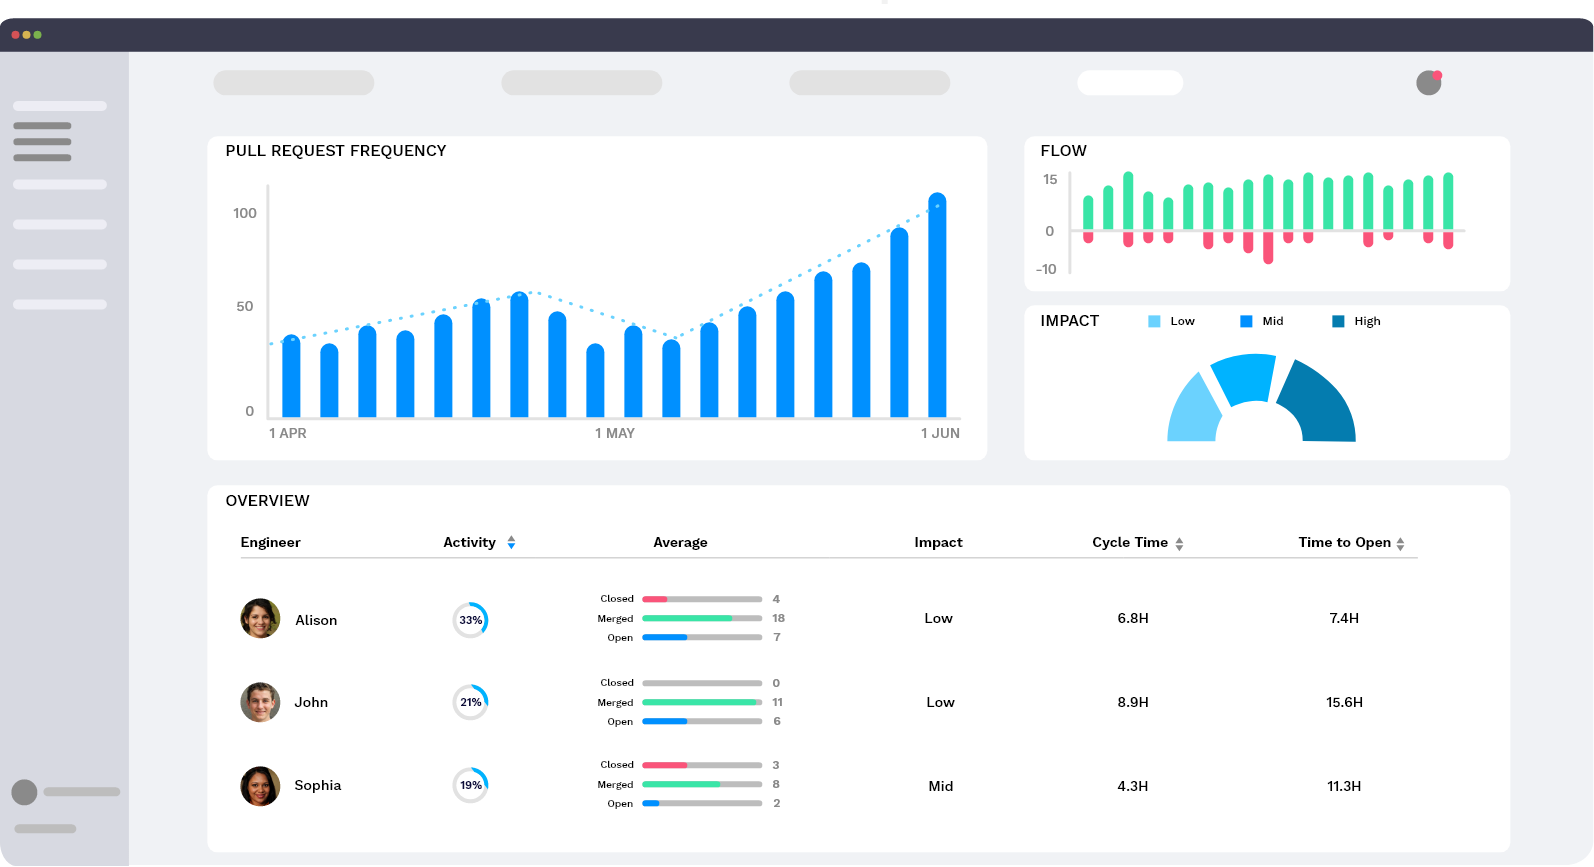
Overview
Analyze task frequency
With these data you will have a better understanding about how different tasks are progressing over time. You will be able to easily identify the most productive days, days in where engineers might be struggling with the code, bottlenecks and even the push frequency. We will help you better understand what is happening at each moment.
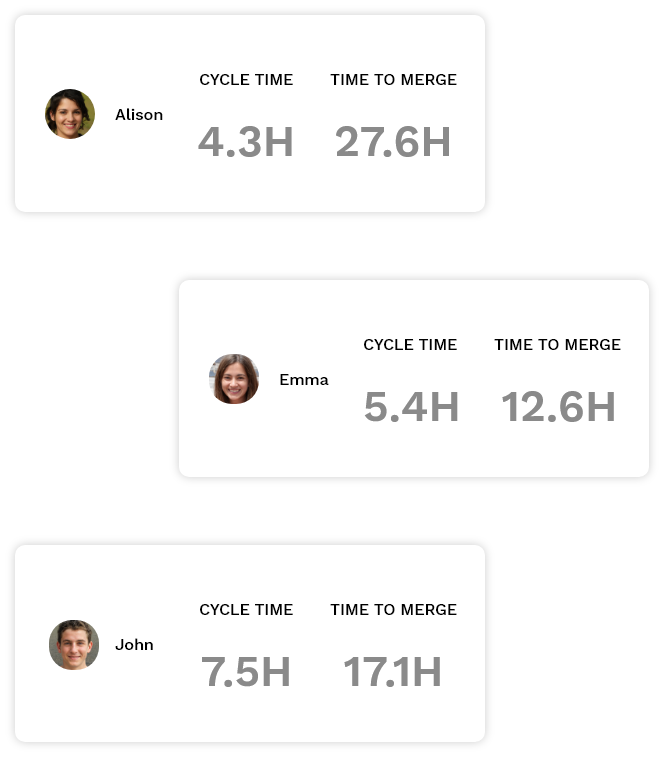
Velocity
Full velocity time context
Track every task and control which pull-requests are opened, merged or closed. Understand the progress of your engineers and repositories. We show the data of the real time it takes to finish the PRs and Reviews. We display the data at the engineer and repository level. In this way, you will be able to see which repositories are being more agile than others, get answers, measure and improve.
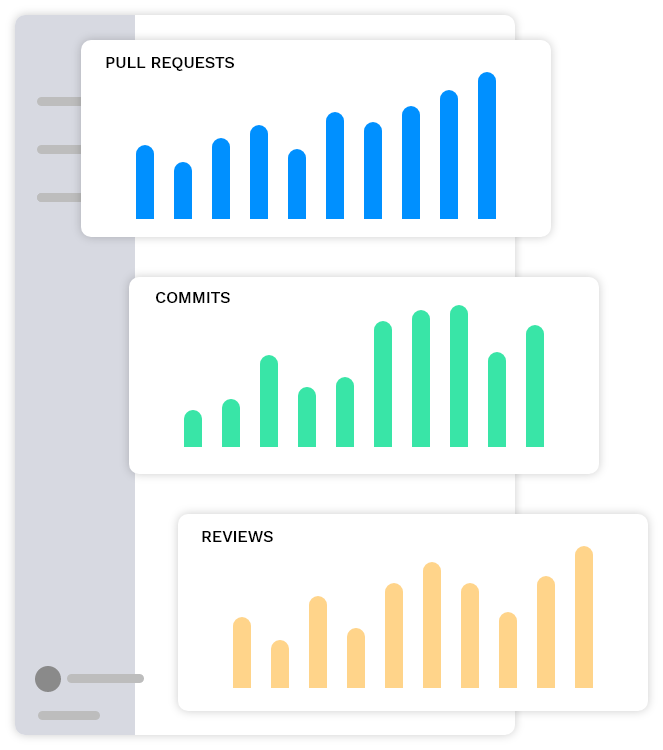
Workflow
See how is the work distributed
See every pull-request in a simple dashboard. Use Scope, to easily understand who is working, and the progress being made on every task. Differentiate between tasks by analyzing the labels of every pull-request. Improve the data that is used in decision making.
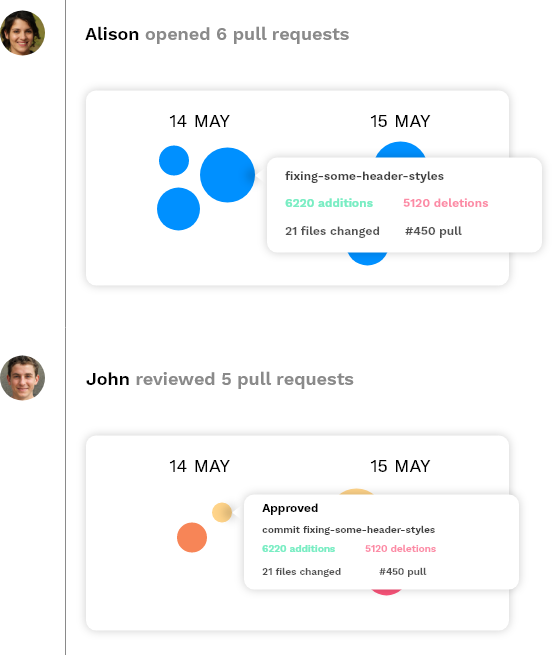
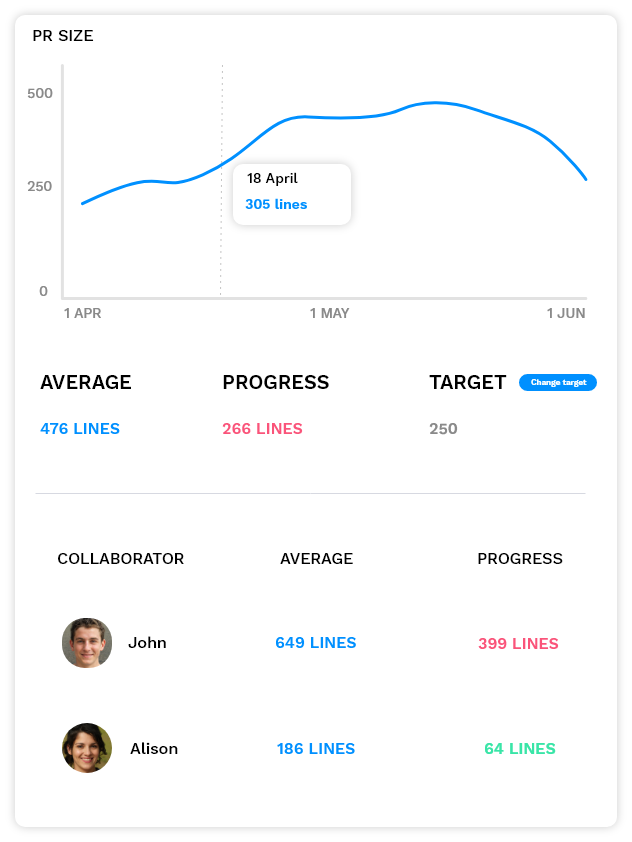
Trends
Measure the trend of your PRs
You will have very valuable information about the workflow of the PRs. The average size of PRs give you poweful insights about how the Cycle Time can be increasing or decreasing over time. Our main goal is to reduce the Cycle Time, and for this, creating small PRs is essential.
Measurable results
Read the success stories with our clients. Learn how teams improve with Scope.

"The Velocity Panel helped us to improve our PR cycle time by reducing the time our engineers take to review other's work. We are using Scope as a metrics-oriented culture of communication and our engineers are more motivated gamifying their processes."
Read Story
"With Scope, our team has increased its PR production cycle by 23%. The insights and statistics urge the teams to push more code and to review faster. A a Product Lead, Scope has also helped us to stablish better and secure goals based in our company reality."
Read Story
"By going very fast, we were realizing that every time we produced the technical debt was increasing. By motivating the team to review more and better, the technical debt rate dropped dramatically. We are creating a better review culture thanks to Scope."
Read Story